Read your reports
How Kibble's Reports page sums up your month, shows spending against your budget, points out what's worth a look, and opens each full report.
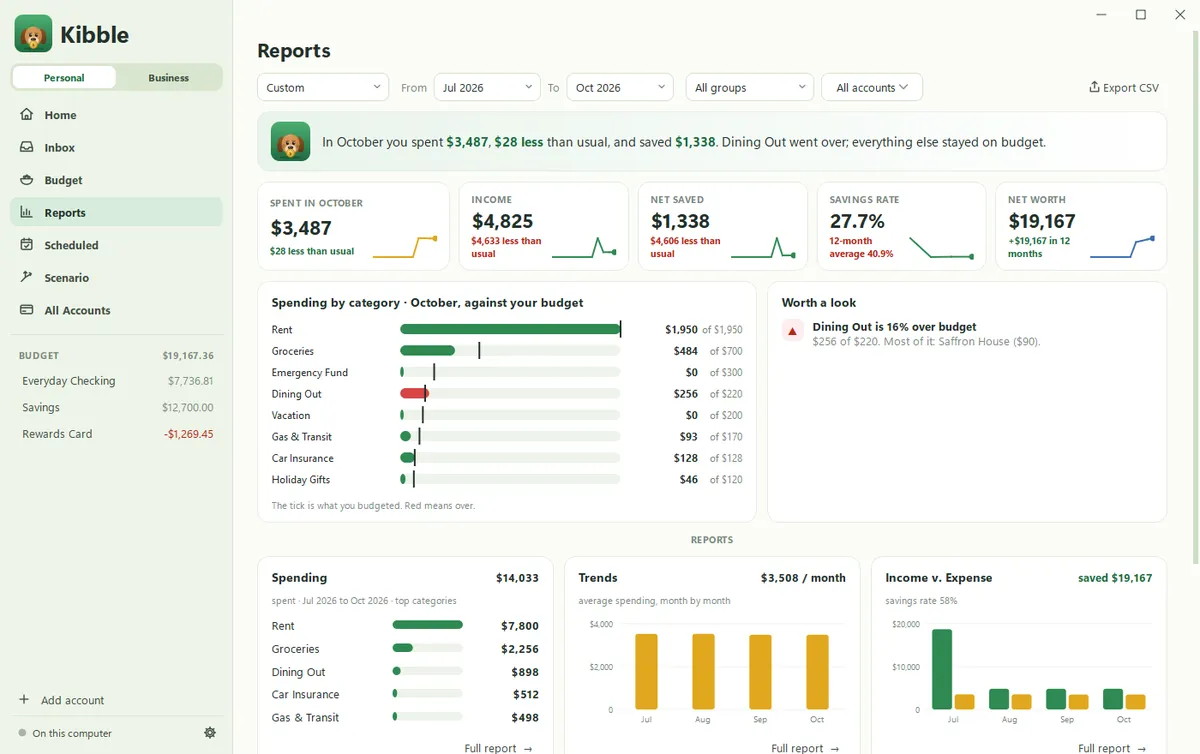
Open Reports in the sidebar (or press R). The top of the page sums up your month: a sentence about how it went, five cards with trend lines, spending against your budget, and a short Worth a look list. Under that, each report is shown in brief. Click Full report to open one on its own page.
What’s in the overview?
- The month: one sentence on what you spent, how that compares with usual, what you saved and what went over.
- Five cards: Spent, Income, Net saved, Savings rate and Net worth, each with a 12-month trend line and a comparison with the year before.
- Spending by category: a bar for each category, with a tick for what you budgeted. Red means over.
- Worth a look: categories that went over budget (and the payee behind it), spending well under your usual, and new charges that look like they repeat.
Pick the period with the From and To months at the top. The overview always describes the last month of that period.
Which reports are there?
| Report | What it shows |
|---|---|
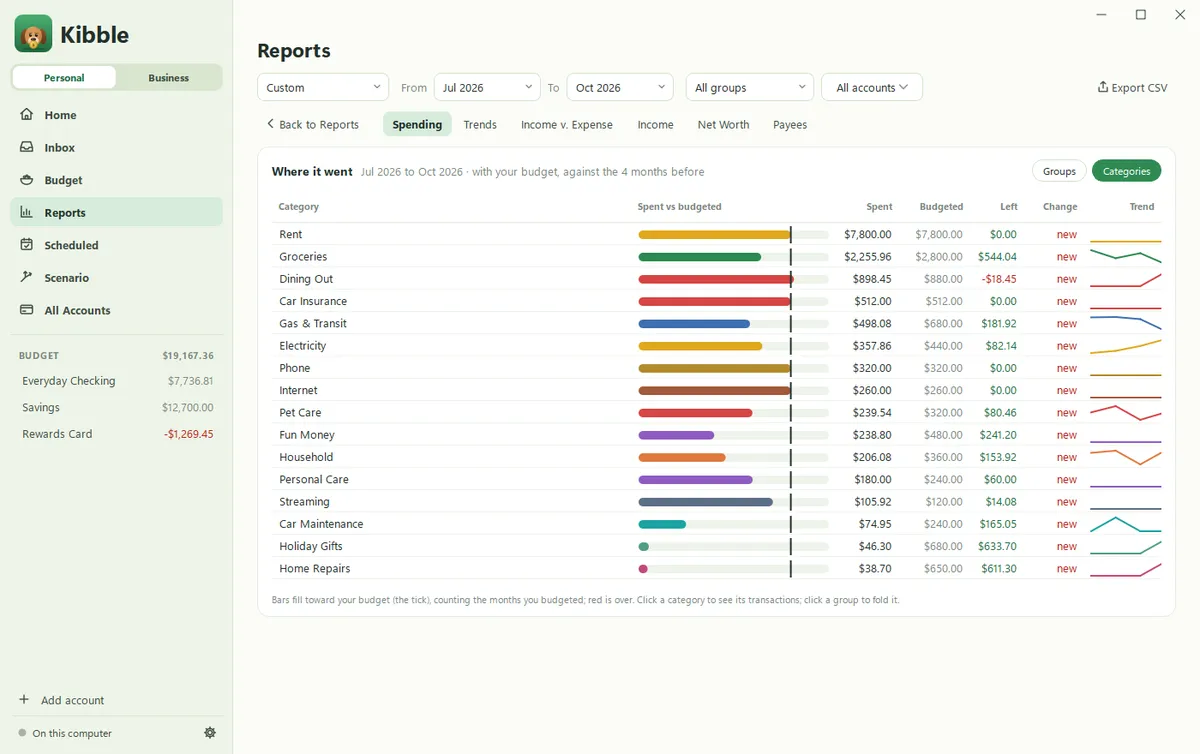
| Spending | Spent, budgeted and left for each group or category, with a bar against your budget and a trend line |
| Trends | Your average, biggest, smallest and climbing categories, over a month-by-month grid |
| Income v. Expense | Income and spending by month, what you’ve saved so far, and your savings rate |
| Income | Income by source, month by month, with each source’s share and months paid |
| Net Worth | Your net worth now, how much came from saving, and each account with its trend |
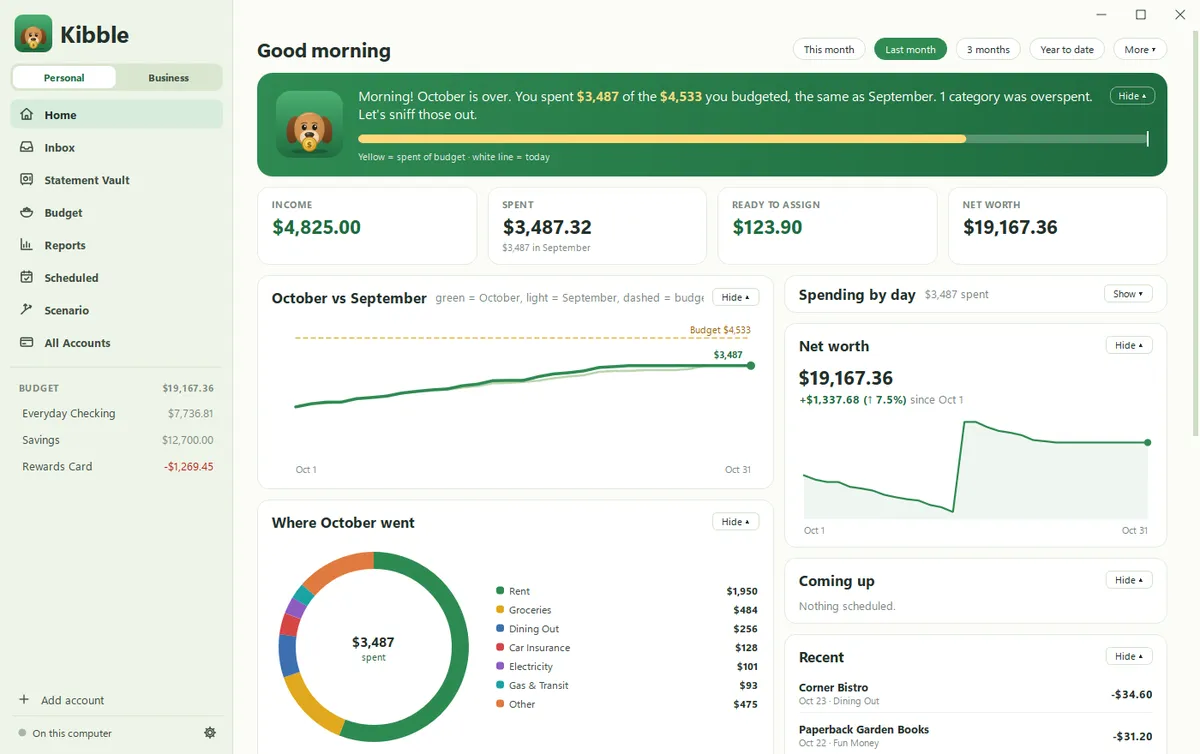
| Payees | Who you pay, sorted by Most spent, Most often or Repeating. Type to search |
How do I open a full report?
Click Full report on any report in brief. The page switches to that report, with tabs to move between reports. Click Back to Reports, or press Esc, to return.
What’s on Home?
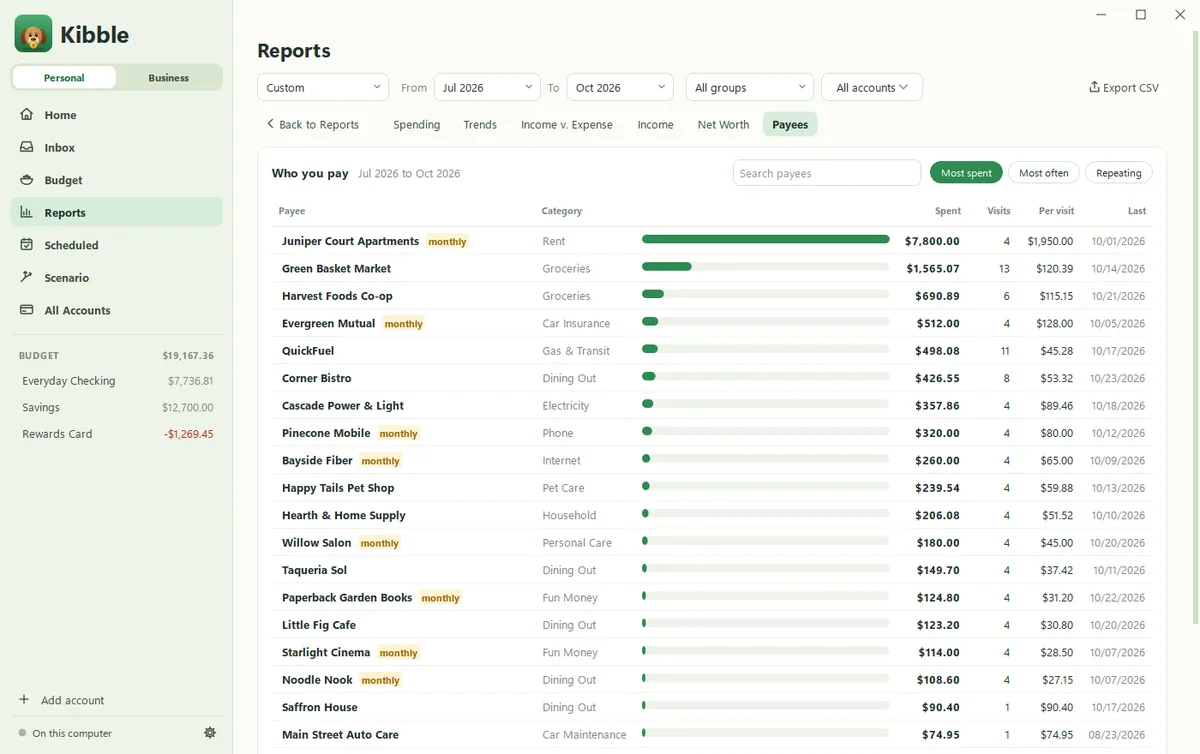
Home (press H) is the quick look. Pick a range at the top: This month, Last month, 3 months (this month and the two before), Year to date, or more under More. Then:
- Cash flow shows what came in, by income category, how much you spent and saved (or how much more went out than came in), and where it went by spending group. Click a group to see its categories.
- Net worth draws a line over the range, with how much it changed.
- Every card has Hide. A hidden card keeps its title and a short summary, with Show to open it again, and it stays hidden after Kibble restarts.
Can I save a report?
Yes. Click Export CSV to save what’s on screen as a spreadsheet file. To save everything, see Export and import your data.
Questions people ask
Which month does the overview show?
The last month of the period you picked. Comparisons like "more than usual" use the 12 months up to it.
Can I see the transactions behind a number?
Yes. Click a row or a bar in any report to see the transactions behind it, and double-click one to edit it.
Can I leave out an account?
Yes. Use the accounts button at the top of Reports to pick which accounts count.
Still scratching your head?
Send us a note and a real person will get back to you.